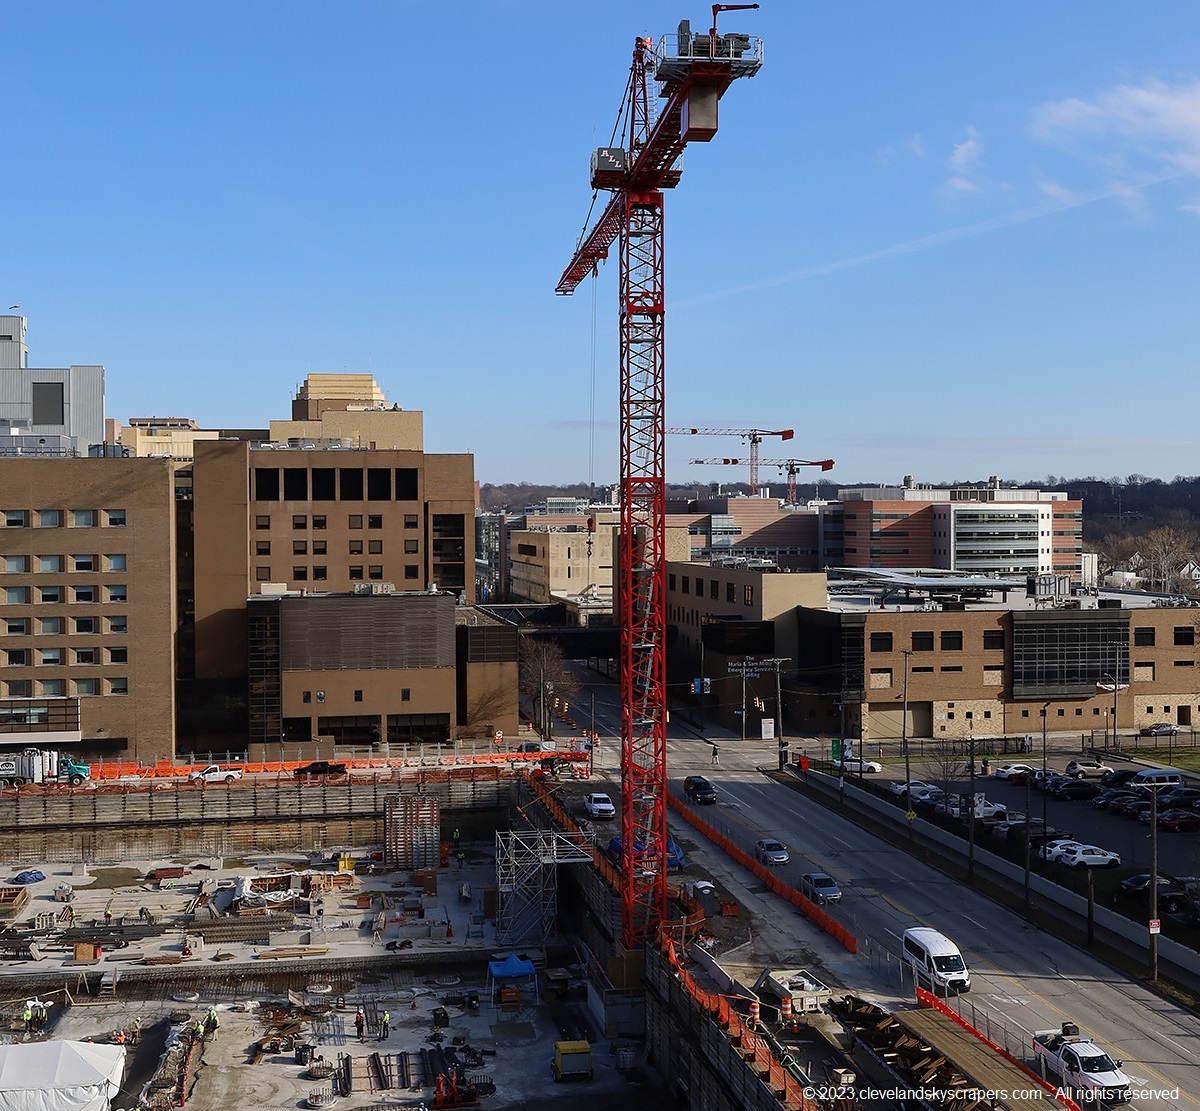
Multiple construction cranes preside over the Cleveland Clinic’s Main Campus near University Circle. In the foreground is the site of one of the largest building projects in Ohio — the 1-million-square-foot Neurological Institute on Carnegie Avenue. It is eclipsed only by the Sherwin-William headquarters downtown. In the distance are two cranes for the Cleveland Clinic’s new Global Center for Pathogen Research & Human Health measuring nearly 300,000 square feet (Courtesy, clevelandskyscrapers.com). CLICK IMAGES TO ENLARGE THEM.
County’s GDP growth ranked 10th in Ohio
In the spirit of Oscar Wilde, one could say that a year’s worth of economic output data might be considered a curiosity. But multiple years may be considered a trend. Last year, the growth of Cuyahoga County’s gross domestic product (GDP) ranked 10th among Ohio’s 88 counties and was the best performer among Ohio’s most populous, urbanized counties. according to new data released last week by the U.S. Bureau of Economic Analysis.
NEOtrans combed through the data and found some interesting comparisons and trends. For example, while Cuyahoga County’s economic output last year did very well last year compared to others in Ohio, it also did well against peer urban counties in the Midwest-Northeast region. But what is perhaps most surprising is that the core county of Greater Cleveland was the only one of the five counties in the metropolitan area whose economy grew last year and was the only to produce more in 2022 compared to 2019 — the year before the pandemic hit.
That runs counter to more than 50 years of urban sprawl trends in which built-out Cuyahoga County has lost jobs and residents to its collar counties of Geauga, Lake, Lorain and Medina counties. But it remains to be seen how or if this latest shift translates into population growth since people often work in one county and live in another. GDP is the value of final goods and services produced within a county yet does not include measurables such as personal income.
Cuyahoga County’s output grew 3.3 percent last year which was above the nation’s GDP growth of 1.9 percent. In 2022, Cuyahoga County produced $104.3 billion worth of goods and services, the second-most in Ohio to Franklin County’s (Columbus) $107 billion. But Cuyahoga County grew faster than Franklin County last year. In fact, among Ohio’s most populous, urban core counties, Cuyahoga outgrew them all.

Greater Cleveland benefitted in 2022 from a national shift in population resulting from remote working. While people may have been working for companies in other cities, they were spending money here on goods and services (KJP).
The following data sets are arranged starting with each county’s name [plus the mother city in that county in brackets], percent change in GDP in 2022 vs 2021, the statewide ranking of that growth, and amount of GDP in that county in 2022 compared to the GDP in 2019 in parenthesis. Here’s how the state’s eight most populous counties performed:
- Cuyahoga [Cleveland] +3.3%, ranking 10th ($104.3B in 2022, $99.5B in 2019)
- Hamilton [Cincinnati] +1.5%, ranking 16th ($82.2B in 2022, $79.9B in 2019)
- Montgomery [Dayton] +1.2% ranking 17th ($30.6B in 2022, $30.0B in 2019)
- Summit [Akron] +1.2% ranking 18th ($31.4B in 2022, $31.0B in 2019)
- Mahoning [Youngstown] +1.0% ranking 22nd ($9.4B in 2022, $9.5B in 2019)
- Franklin [Columbus] +0.6% ranking 23rd ($107B in 2022, $100.8B in 2019)
- Stark [Canton] -0.2% ranking 37th ($16.97B in 2022, $17.0B in 2019)
- Lucas [Toledo] -2.7% ranking 67th ($24.8B in 2022, $25.6B in 2019)
Greater Cincinnati also has Kenton County, KY which produced $9.6 billion in GDP in 2022 and grew 1.3 percent, making it the fourth-fastest growing county in Kentucky. Metro Toledo extends into Monroe County, MI which provided $5.7 billion of output last year although that shrank a half-percent compared to 2021. Greater Youngstown includes Mercer County, PA which added $4.2 billion of GDP in 2022, an increase of 2 percent over the year before, Bureau of Economic Analysis data shows.
A factor in play for Cuyahoga County’s growth in 2022 was a national shift in population resulting from remote working. Although people relocating to Greater Cleveland may have been working for companies in other cities, they were spending their money here on goods and services. That relocating population includes college graduates looking for an affordable place to live and work, resulting in Greater Cleveland enjoying “brain gain” for the first time in perhaps decades.
The top-10 Ohio counties in 2022 with the fastest growing GDP were led by Vinton County, Ohio’s least populous. It saw its economic output grow by 15.5 percent to $357 million. According to the county’s economic development department, Vinton’s largest employer is Beachwood-based Austin Powder Co. which has a plant that makes mining explosives. Also in Vinton County is Steelial Construction & Metal Fabrication Co. plus several timber industry firms.

Cleveland’s second-largest employment center after downtown is the fast-growing University Circle. Its skyline also grew in 2022 with The Artisan apartments topping out at 250 feet and becoming the district’s tallest, overcoming the 234-foot-tall One University Circle at left (Noah Belli).
Rounding out Ohio’s other top-10 fastest-growing county economies in 2022 were Columbiana (GDP rising 10% to $3.5 billion), Mercer (5.2% to $2.4B), Pike (4% to $1.25B), Delaware in suburban Columbus (3.8% to $14.2B), Defiance (3.7% to $1.7B), Auglaize (3.7% to $2.6B), Ross (3.6% to $3B), Carroll in suburban Canton (3.6% to $1.1B), and Cuyahoga.
Ohio’s 10 poorest-performing counties in terms of GDP output in 2022 compared to 2021 were Belmont (GDP falling 19% to $2.3 billion), Monroe (-16% to $808M), Gallia (-8% to $1.88B), Harrison (-7.1% to $852M), Guernsey (-7% to $1.9B), Adams (-5.2% to $731M), Ottawa (-1.9% to $585M), Morrow (-4.3% to $638M), Crawford (-4.1% to $1.3B) and Meigs (-3.9% to $370M). All of those are rural or mostly rural counties.
But trends over time tell a more enduring tale of a county’s economic performance. And those that had more economic output in 2022 compared to 2019 — the year before the COVID-19 pandemic — show which ones have recovered from the pandemic’s economic shock, which ones haven’t and which ones are growing above and beyond their pre-pandemic performance.
Thirty-three Ohio counties have achieved more than a one-half of one (0.5) percent increase in GDP output in 2022 compared to 2019. They were Allen, Auglaize, Brown, Columbiana, Cuyahoga, Darke, Defiance, Delaware, Fairfield, Franklin, Greene, Hamilton, Licking, Madison, Mercer, Miami, Montgomery, Morgan, Muskingum, Paulding, Pickaway, Preble, Putnam, Richland, Ross, Sandusky, Seneca, Summit, Union, Vinton, Warren, Wayne and Wood counties. More than one-third of those counties are large urban or suburban counties.

One of Greater Cleveland skyrocketing economic engines is the NASA Glenn Research Center, the only such center north of the Mason-Dixon Line. Not only does NASA produce thousands of good-paying jobs, the spinoff research creates even longer-lasting value (NASA).
Only 16 Ohio counties had barely recovered in 2022 from the pandemic. They merely achieved parity with their 2019 GDP, neither rising or shrinking more than one-half of one percent. Those counties were Ashland, Ashtabula, Butler, Champaign, Fayette, Fulton, Hardin, Henry, Highland, Hocking, Holmes, Mahoning, Pike, Stark, Van Wert and Wyandot.
Unfortunately, 39 Ohio counties had lower economic outputs in 2022 when compared to 2019, suggesting they have not recovered from the pandemic. Those were Adams, Athens, Belmont, Carroll, Clark, Clermont, Clinton, Coshocton, Crawford, Erie, Gallia, Geauga, Guernsey, Hancock, Harrison, Huron, Jackson, Jefferson, Knox, Lake, Lawrence, Logan, Lorain, Lucas, Marion, Medina, Meigs, Monroe, Morrow, Noble, Ottawa, Perry, Portage, Scioto, Shelby, Trumbull, Tuscarawas, Washington and Williams counties.
While the nation’s GDP grew 1.9 percent, GDP from all U.S. metropolitan areas grew 2.1 percent in 2022 compared to 2021, the Bureau of Economic Analysis noted. According to its data, U.S. Census-designated metropolitan statistical areas in the Midwest-Northeast region that are peers to Greater Cleveland all grew in economic output year-over-year in 2022. Metro Indianapolis performed the best while Greater Pittsburgh grew the least.
Output from the Cleveland metropolitan area, comprised of Cuyahoga, Geauga, Lake, Lorain and Medina counties, grew last year at a 2 percent rate that was slightly less than that of all metro regions nationwide. Greater Cleveland would have performed equal to or better than the national average if the four collar counties around Cuyahoga had not seen their economies shrink last year. As noted earlier, Cuyahoga County was the only one to enjoy GDP growth.

Moving to Cleveland from ‘superstar’ cities has saved new arrivals an average of nearly $200,000 in the value of their housing, a recent analysis shows. That’s one result of the Great Reshuffling that’s allowing people to get more bang for their buck by working remotely in amenity-laden cities like Cleveland (alliecarr.com).
This list of peer metro areas in the Midwest-Northeast region shows how their GDP changed in 2022 vs 2021 and what their GDP was in 2022:
- Buffalo, NY grew 2.8% to $84.7B
- Cincinnati, OH-KY-IN grew 1% to $186.1B
- Cleveland, OH grew 2% to $162.8B
- Columbus, OH grew 0.9% to $169.9B
- Detroit, MI grew 1.8% to $305.4B
- Indianapolis, IN grew 3.3% to $184.4B
- Milwaukee, WI grew 1% to $120.6B
- Minneapolis-St. Paul, MN grew 1.4% to $324B in 2022
- Pittsburgh, PA grew 0.2% to $181.5B
- St. Louis, MO-IL grew 2.1% to $209.94B
The relative economic growth of urban areas nationwide and especially in Ohio continues a trend that accelerated in the late-2010s. In that time period, most rural areas remained stagnant at best. Ohio’s modest economic growth was caused entirely by its six largest metropolitan areas and especially by its three largest — Cleveland, Columbus and Cincinnati.
From 2015-2019, according to the U.S. Bureau of Labor Statistics, Ohio gained 227,000 jobs. If it wasn’t for Ohio’s six-largest metro areas, the state would have lost 18,000 jobs. But Ohio’s economic strength in the late-2010s came from its three largest metro areas. Of the state’s 227,000 additional jobs 2015-2019, Greater Cleveland, Columbus and Cincinnati accounted for 216,000 of them.
END