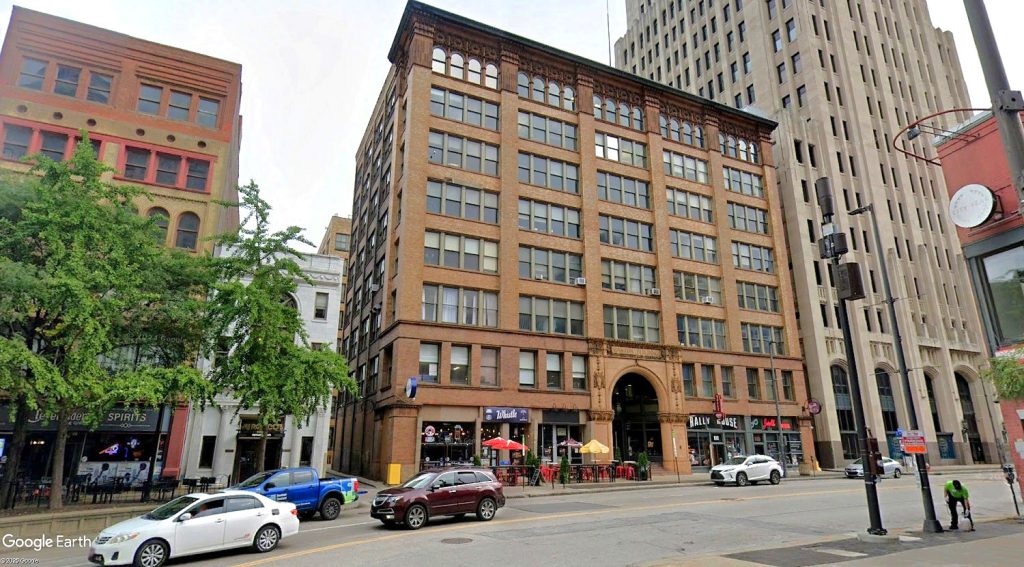

Greater Cleveland’s largest and fastest-growing job sector is education and health services, or “eds and meds.” One of the biggest employment drivers is the Cleveland Clinic Foundation. Here, at its new Ted Ross Lab at Lerner Research Institute, Clinic workers help develop vaccines in a tissue culture room. Ross is Global Director of Vaccine Development at Cleveland Clinic (CCF). CLICK IMAGES TO ENLARGE THEM.
Greater Cleveland jobs led by ‘eds-n-meds’ sector
For many Greater Clevelanders, they had a merry Christmas thanks to one of the tightest job markets locally in more than two decades. According to preliminary data released late last week by the U.S. Bureau of Labor Statistics (BLS), the unemployment rate for the Cleveland-Elyria-Mentor metropolitan area was the lowest it has been since December 2000.
In its preliminary labor statistics for November 2023, the BLS reported that the Greater Cleveland unemployment rate fell to 2.7 percent, the lowest since it dipped to 2.3 percent in December of 2000. It’s a strong sign of recovery from the depths of the COVID-19 pandemic in the spring of 2020 when the world economy was shut down. Because the data is preliminary, it could be refined somewhat in the next month or so, however.
“Nearly every sector across our region continues to grow,” said Baiju Shah, president and CEO of the Greater Cleveland Partnership, the region’s chamber of commerce, told NEOtrans. “Business growth is continuing to outpace workforce growth, and while the region continues to gain population, it has not been fast enough yet.”
Job growth in Greater Cleveland in November 2023 was 1.8 percent compared to November 2022 and led by its largest employment sector — education and health services, dubbed “eds and meds.” That sector grew 7.3 percent versus the same month last year to 218,000 employed persons, continuing a year-long surge after stagnating for two years after the pandemic.
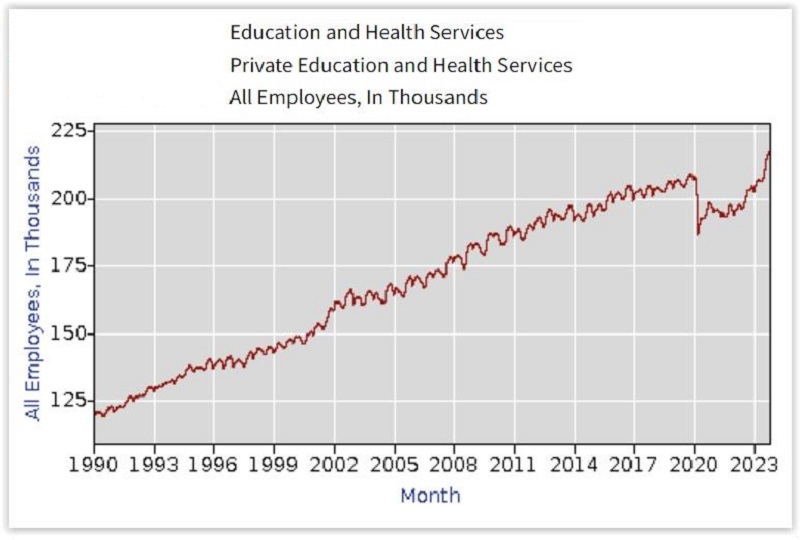
The education and health services employment sector is not only Greater Cleveland’s largest job category, it’s also its most steady in terms of growth. While it took several years to recover from the pandemic, eds-and-meds is the only sector locally to have more workers now than at any time since Bureau of Labor Statistics data was made available online in 1990 (BLS).
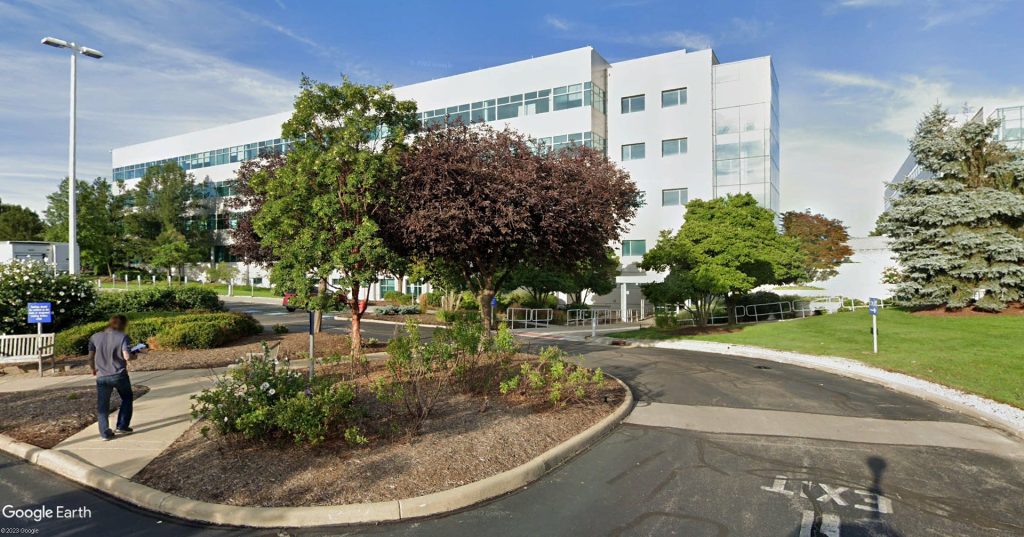
That latest surge in the eds-and-meds sector has been so strong that it pushed its employment to record highs for the metro area. The region’s largest employer Cleveland Clinic has led that growth. But so have others including the growing Case Western Reserve University, University Hospitals Health System and the MetroHealth System.
Another sector that’s been performing strongly in recent months is the mining, logging and construction category. It grew 4.3 percent in November 2023 compared to November 2022. While that would be a good month for most sectors, it’s a regression to the mean for the construction-dominated group that grew 9.8 percent in October and 7.7 percent in July. Total employment in the sector is also higher than it has been in 15 years but still off the post-1990 peak of 1999-2000. Available BLS online data goes back to 1990.
Unfortunately, Greater Cleveland’s second-largest job sector, trade, transportation and utilities, is struggling as it is nationwide. Its local employment levels this year have fallen to those seen in the months following the depths of the pandemic. For the metro area, this group has been stagnant since the Great Recession of 2008-09, BLS data shows.
Other sectors locally are growing but not spectacularly. They include professional and business services which is the third-largest job category in Greater Cleveland. It grew 1.8 percent in November after few if any gains in the past year. Government, the fourth-largest sector, grew 2.1 percent, continuing slow, but steady growth in recent months.
Manufacturing, which used to be Greater Cleveland’s largest job category, is now it’s fifth-largest. It also is growing slow and steady. In other sectors in the region, leisure and hospitality gained jobs at a 3-percent clip compared to the same month last year while the slightly smaller category of financial activities lost jobs at a 4.5-percent rate in November. BLS data shows those were similar to rates of gains and losses for both sectors in recent months.
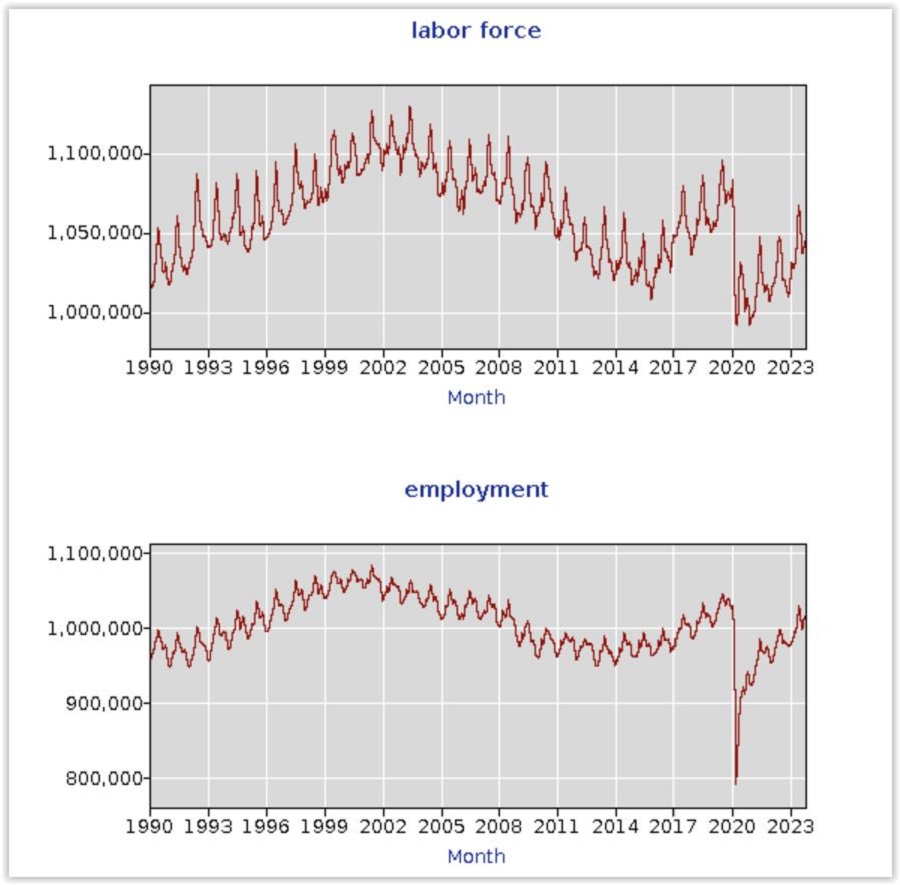
The seasonality of Greater Cleveland’s employment is evident in these charts, as is the result of global economic and political forces on the local economy, especially since the early 2000s. The pandemic and retirement of Baby Boomers stunted the region’s recovery after the mid-2010s (BLS).
As rosy as some of the latest data is, the region’s labor force has yet to return to two prior peaks in the past 30 years of available data. The most recent peak was right before the pandemic. The highest peak came in the early 2000s, prior to local and global factors causing Greater Cleveland’s economy to decline for a decade, resulting in steady job losses.
A reversal began in the mid-2010s but the pandemic briefly stunted that regional employment rebound. The metro area is also seeing its labor force be affected by the retirement of Baby Boomers. But they are being supplanted in the labor force by the arrival of younger people seeking more affordable living. Greater Cleveland is experiencing a trend of “Brain Gain” — the growth in college-educated youth — for the first time in a very long time.
Greater Cleveland’s unemployment rate in April 2020 shot up to 20.5 percent, its labor force briefly dipped below 1 million and the number of people employed locally fell to a mere 790,107 persons. Never in the last 34 years of available BLS data has the number of employed persons fallen to a lower level, not even in the wake of the 2008-09 Great Recession.
If current job growth rates continue, the Greater Cleveland area should return in three to four years to the same labor force and level of employment it had in 2019, the year before the pandemic. In July 2019, the metro area’s labor force approached 1.1 million or, more specifically, 1,094,588 people and there were 1,044,725 employed persons, BLS data shows.
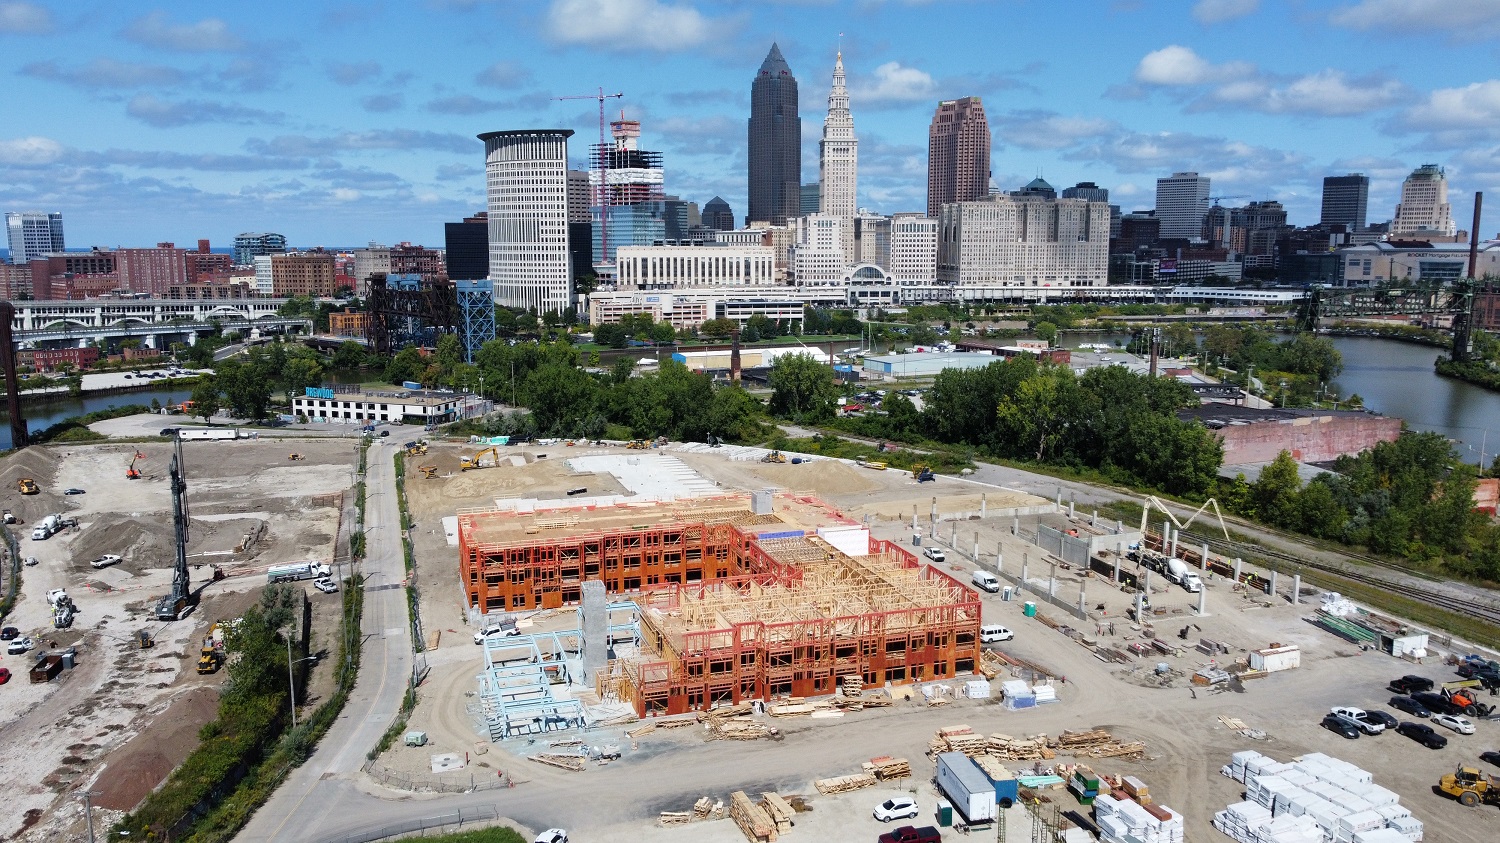
In addition to eds and meds, construction has been a strong and growing source of employment to Greater Cleveland in 2023, with growth rates ranging from 4.3 to 9.8 percent compared to the same months last year (Adam Greene).
Despite fewer people in the labor force, the region is producing about as much value from its goods and services since before the pandemic, with Cuyahoga County producing more. Cuyahoga was the only county in Greater Cleveland whose gross domestic product was higher last year than it was in 2019, according to data from the U.S. Bureau of Economic Analysis released just two weeks ago.
Since Greater Cleveland’s economy tends to be seasonal, it’s best to compare data from a month in one year to the same month in another year. The highest employment season locally is the summer, with July usually being the highest month. In July 2023, there were 1,066,838 people in Greater Cleveland’s labor force and 1,029,043 employed persons, or 27,750 and 15,682 fewer people respectively compared to the most recent peak of July 2019.
In the late 1990s and early 2000s, the Cleveland metro area was also enjoying strong employment growth. Back then, the unemployment rate didn’t rise above 5 percent from June 1995 to February of 2002. For several months in late 1998, BLS noted the unemployment rate in Greater Cleveland dropped to as low as 1.7 percent.
The region’s labor force was larger then, too. In June of 2003, Greater Cleveland peaked at 1,129,174 working-age adults who were employed or seeking employment, it’s peak of employment since 1990. Although unemployment in June 2003 was 6.3 percent. After the early 2000s, Ohio lost nearly 400,000 manufacturing jobs with Northeast Ohio hit disproportionately hard. The bottom came in February 2013 with only 947,507 Greater Clevelanders employed in a labor force of 1,025,363.
“More than 1 million Ohioans worked in the manufacturing sector at the beginning of 2000,” the Carnegie Endowment for International Peace wrote in a 2018 report. “That number dropped to just over 620,000 in 2010; the approximately 400,000 manufacturing jobs lost were the most during any decade since manufacturing employment peaked in 1969 (at 1.37 million). This was due to three dominant factors: China’s accession to the WTO (World Trade Organization), automation, and the Great Recession.”
END